
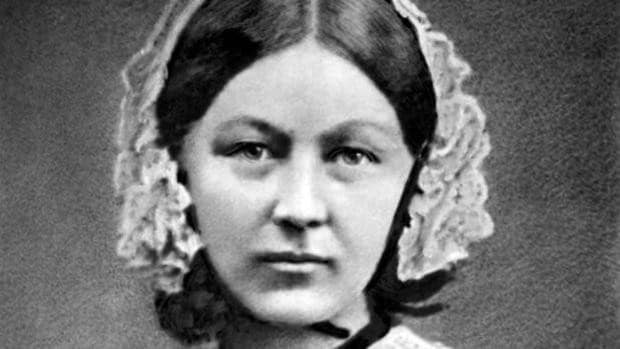
 Florence Nightingale (1820-1910) is known to the general public primarily for being the founder of modern nursing, but not so much for her contributions to the field of statistics.
To understand her career, it is necessary to first delve into her biography, because the initial desire of this woman, who came from a wealthy family, was to be a mathematician. For this reason, during her adolescence, she received classes from the mathematician James Joseph Sylvester (1814-1897), founder of the American Journal of Mathematics and credited with coining terms such as matrix, graph, and discriminant.
Unfortunately, her family was, from the very beginning, totally reluctant to let her dedicate herself to mathematics, as they did not think it was a useful profession for a woman of her social position.
Nurse in the Crimean War
Of course, her career choice didn't please them either; her parents were even more hesitant, if possible, to consider nursing as a suitable choice for her. However, this mattered little to her; Florence had decided to become a nurse, first going to Salisbury and later completing her studies in Germany.
With her degree in hand, she was sent to the Crimean War (1853-1856) along with nearly forty of her colleagues. The British government assigned them to work in a field hospital in Scutari (Istanbul). This event marked a revolution in Victorian society, as it was the first time a woman was officially allowed to serve in the British army.
The sight those women faced at Scutari could not have been more devastating: the hospital was filthy, the floor was covered in feces, and soldiers were dying everywhere as a result of malnutrition and poor hygiene.
On the ground, Florence found that the mortality rate among the English was 1,174 per ten thousand soldiers, of whom 1,023 died not from war wounds, but as a result of infectious diseases (typhus, typhoid fever, cholera, dysentery, etc.).
The Rose Diagram
When he returned to London at the end of the conflict, he gathered all the notes he had taken and designed, with the help of two renowned statisticians (William Farr and John Sutherland), a circular diagram, very easy to understand and which he named the "Rose Diagram."
Its representation is similar to a pie chart, although the radius is modified so that quantities can be represented instead of angles, achieving a visual effect not achieved with a histogram. The number of deaths caused by infectious diseases is represented in blue, those attributed to injuries in pink, and those caused by other causes in gray.
A brief analysis showed that 16,000 of the 18,000 deaths were not due to battlefield wounds, but to infections. Furthermore, it showed that mortality had been reduced by up to 99% during the year the nurses were on the battlefield. Florence thus became the first person to use a statistical graph to persuade authorities to change their strategy in order to improve soldiers' health.
And as she herself summarized, we must "achieve through the eyes what we are unable to transmit to the minds of citizens through their ears, which are insensitive to words."
Pedro Gargantilla is an internist at the El Escorial Hospital (Madrid) and author of several popular books.